Need to watch your network without spending a fortune? Here's what you need to know about free network monitoring tools:
| Tool | Best For | Key Features |
|---|---|---|
| Nagios Core | Small networks | Basic monitoring, 5000+ plugins, email alerts |
| Zabbix | Medium/large networks | Auto-discovery, real-time tracking, custom dashboards |
| Prometheus | Cloud systems | Time-series data, scaling, container support |
| OpenNMS | Enterprise networks | Service checks, traffic analysis, event handling |
Why use open source monitoring tools?
| Benefit | What You Get |
|---|---|
| Cost | $0 licensing fees |
| Control | Full access to code |
| Community | Global support network |
| Flexibility | Add features as needed |
| Updates | Regular security patches |
Quick start guide:
- Pick Nagios Core for basic monitoring
- Choose Zabbix for bigger networks
- Use Prometheus for cloud/containers
- Try OpenNMS for complex setups
Think of open source monitoring like having security cameras for your network - you'll spot issues before they become problems, all without paying for expensive software.
Want to get started? Download one of these tools and try it out. You'll know pretty quickly if it fits your needs.
Related video from YouTube
Which of the following is an open source network monitoring software?
Here's what you need to know about the top open source network monitoring tools in 2024:
| Tool | Key Features | Best Use Case |
|---|---|---|
| Prometheus | - Tracks time-series data - Manages alerts - Collects network stats |
Big systems that need scaling |
| Zabbix | - Finds devices automatically - Monitors in real-time - Makes custom views |
Big business networks |
| Nagios Core | - Does basic checks - Works with plugins - Sends email alerts |
Small-medium networks |
| OpenNMS | - Checks services - Looks at traffic - Handles events |
Networks with lots of parts |
| Icinga 2 | - Supports multiple users - Has API access - Monitors from different spots |
IT systems |
These tools keep an eye on:
- How fast your network runs
- CPU and memory stats
- If servers are up
- Security issues
- System records
Here's the bottom line:
If you run a small team, Nagios Core might be all you need. For bigger networks, take a look at Prometheus or Zabbix. Need lots of charts? Try Cacti. Want something simple? LibreNMS could work.
The best way to choose? Download a few and try them out. You'll know pretty quickly which one feels right for your setup.
Is Nagios still relevant?
Nagios keeps going strong in 2024, even after 20+ years in the game. Here's what makes it stick around:
| Aspect | Impact on Modern Monitoring |
|---|---|
| Plugin System | 5,000+ plugins support modern tech stacks |
| Market Share | Used by 40% of Fortune 500 companies |
| Community | 1M+ active users contributing fixes |
| Updates | Monthly security patches and updates |
| Integration | Works with modern tools like Docker, Kubernetes |
Think of Nagios like a Swiss Army knife - it might not be the newest tool, but it gets the job done. Here's what it does best:
- Basic Monitoring: Tracks uptime without breaking a sweat
- Email Alerts: Tells you when something's wrong (and fast)
- Low Resource Use: Runs smooth on basic hardware
- Plugin System: Add what you need, when you need it
But let's be real - Nagios isn't perfect. Here's how it stacks up against the new kids on the block:
| Feature | Modern Tools | Nagios Core |
|---|---|---|
| Auto-scaling | Yes | No |
| Container Support | Built-in | Plugin needed |
| UI Experience | Modern | Basic |
| Setup Time | Minutes | Hours |
| Learning Curve | Low | High |
So, should you use Nagios in 2024? It depends.
If you need basic monitoring or have a small setup, Nagios works just fine. But if you're running a complex cloud operation or need fancy features right away, check out tools like Prometheus or Zabbix instead. It's like choosing between a reliable tool and the thrill of something new—much like the fun of CS:GO roulette, where every spin brings a chance to win big and enjoy competitive, adrenaline-fueled gameplay.
Bottom line: Nagios isn't old news - it's just built for specific jobs. Use it when you want something battle-tested for basic monitoring. Pick something else when you need the bells and whistles from day one.
Is Nagios a free tool?
Nagios offers both a free and paid version:
| Version | Cost | Features |
|---|---|---|
| Nagios Core | Free | Basic monitoring, alerts, plugins |
| Nagios XI | Starts at $1,995 | Advanced UI, wizards, reporting |
The free version (Nagios Core) includes:
- Source code access
- Basic web UI
- Command line tools
- Plugin support
- Email alerts
Here's what you get with each version:
| Feature | Nagios Core (Free) | Nagios XI (Paid) |
|---|---|---|
| Setup | Manual config files | Auto-configuration |
| Interface | Basic HTML | Modern dashboard |
| Reports | Basic | Advanced analytics |
| Support | Community forums | 24/7 tech support |
| Updates | Manual | Automatic |
Nagios Core works for you if you:
- Can handle code
- Like text configs
- Want to learn monitoring
- Need basic features
Small teams and personal projects do fine with Core. But bigger companies usually go for XI because of its features and support.
| Use Case | Best Version |
|---|---|
| Personal projects | Core |
| Small business | Core |
| Learning monitoring | Core |
| Enterprise use | XI |
| Complex networks | XI |
Which is the most common tool used for network monitoring?
SNMP (Simple Network Management Protocol) dominates network monitoring. It's used in 8 out of 10 enterprise networks. Here's what the monitoring landscape looks like:
| Tool Type | Market Share | Primary Use |
|---|---|---|
| SNMP | 80%+ | Device monitoring |
| Syslog | 65% | Log management |
| NetFlow | 45% | Traffic analysis |
| WMI | 35% | Windows monitoring |
SNMP has three main parts that work together:
| Component | Function | Example |
|---|---|---|
| Manager | Collects data | Zabbix server |
| Agent | Reports metrics | Router SNMP agent |
| MIB | Data structure | CPU usage metrics |
Most popular open source tools work with SNMP right away:
| Software | SNMP Support | Features |
|---|---|---|
| Nagios Core | Yes | Basic polling |
| Zabbix | Yes | Templates, discovery |
| OpenNMS | Yes | Auto-detection |
| Cacti | Yes | Graphing focus |
Want to start with SNMP monitoring? Here's what to do:
- Pick SNMPv3 for better security
- Monitor basic stuff first (uptime, interface status)
- Focus on your most important devices
- Set up device discovery
- Keep your SNMP strings secret
Why do network admins LOVE SNMP? Here's why:
| Advantage | Description |
|---|---|
| Universal | Works on most devices |
| Light | Minimal network impact |
| Standard | Consistent across vendors |
| Scalable | Handles thousands of devices |
sbb-itb-9c854a5
Types of Network Monitoring Explained
Here's a breakdown of the four main network monitoring types and how they work.
Real-Time Monitoring vs. Historical Analysis
Think of network monitoring like checking your car's dashboard. Sometimes you need to know what's happening RIGHT NOW (like your speed). Other times, you want to look back at your maintenance history.
| Monitoring Type | Time Window | Main Use Cases | Common Tools |
|---|---|---|---|
| Real-Time | 0-5 minutes | Outage detection, DDoS response | Nagios Core, Zabbix |
| Near Real-Time | 5-15 minutes | Performance tracking, capacity planning | Prometheus |
| Short-Term History | 1-30 days | Trend analysis, reporting | Cacti |
| Long-Term History | 30+ days | Capacity planning, compliance | OpenNMS |
Open Source Network Traffic Analyzers
These tools look at your network traffic at the packet level - like having X-ray vision for your data:
| Tool | Focus Area | Data Collection Method |
|---|---|---|
| Wireshark | Packet analysis | Direct capture |
| ntopng | Flow monitoring | NetFlow/sFlow |
| Zeek | Security monitoring | Network taps |
| Moloch | Full packet capture | PCAP storage |
Application Performance Management Integration
Here's how network and application data work together:
| Integration Type | Metrics Tracked | Storage Method |
|---|---|---|
| Log Analysis | Error rates, response times | Time-series DB |
| Trace Analysis | Service dependencies | Graph DB |
| Metric Collection | Resource usage | RRD files |
| Event Correlation | Incident patterns | Search index |
Device and Service-Specific Monitoring
Different network devices need different monitoring - just like how you wouldn't check your car's oil as often as your fuel gauge:
| Device Type | Key Metrics | Polling Interval |
|---|---|---|
| Routers | Interface errors, BGP status | 1-5 minutes |
| Switches | Port status, VLAN health | 2-10 minutes |
| Firewalls | Connection states, rule hits | 3-15 minutes |
| Load Balancers | Backend health, SSL status | 30-60 seconds |
Here's what works:
- Start with baseline measurements for each device
- Set polling times based on how critical the device is
- Use SNMP to track hardware
- Monitor services through their APIs
- Keep your data for at least 30 days
Free Open Source Network Monitoring Tools
Zabbix Network Monitoring
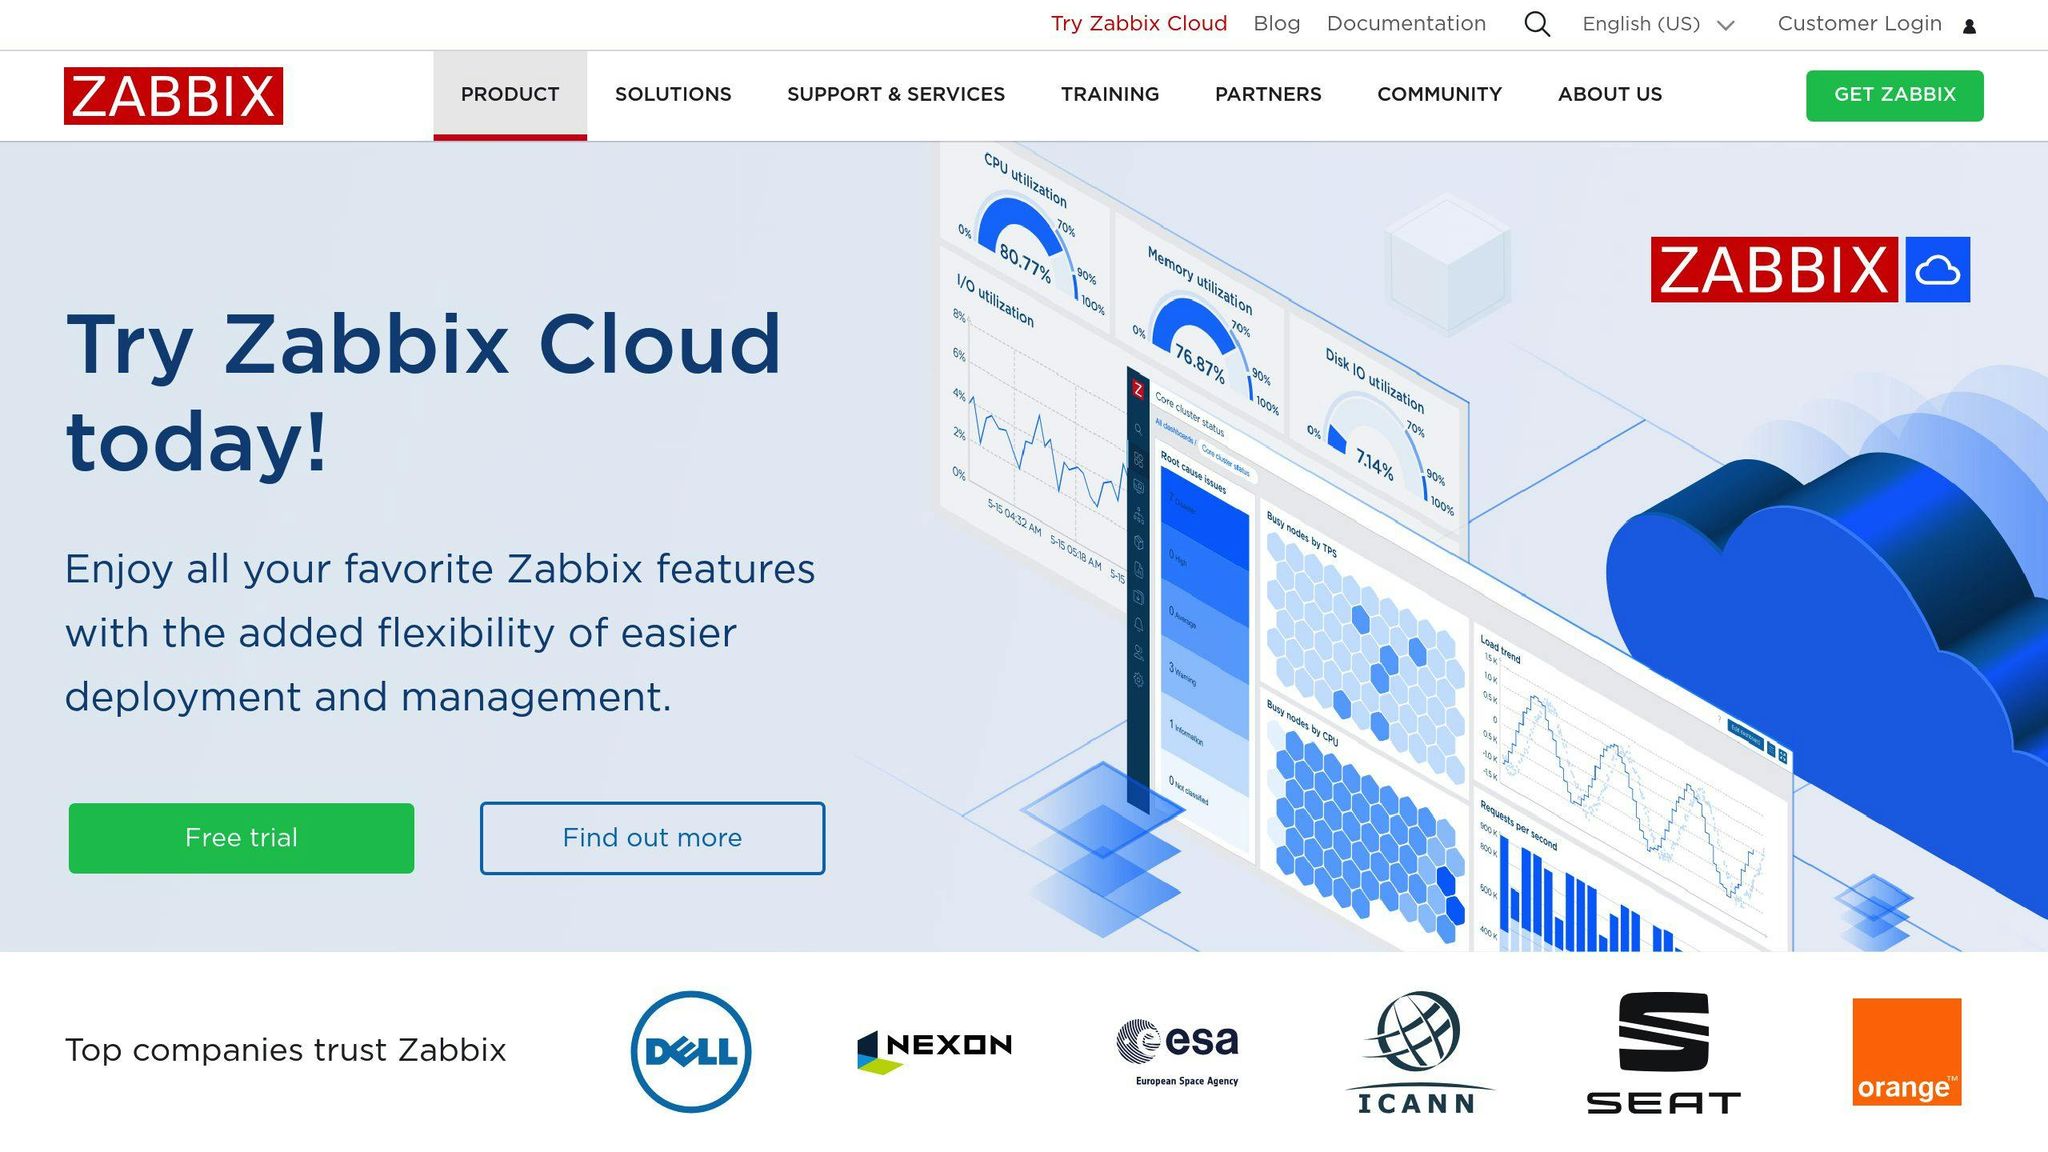
Zabbix packs a punch with its monitoring features. Here's what you get:
| Feature | Description | Use Case |
|---|---|---|
| Auto-discovery | Spots network devices automatically | Networks that change often |
| Custom Scripts | Works with Python, Perl, Shell | Special monitoring jobs |
| Templates | Ready-to-use monitoring packages | Fast setup |
| API Access | REST API for automation needs | Tool integration |
Nagios Core
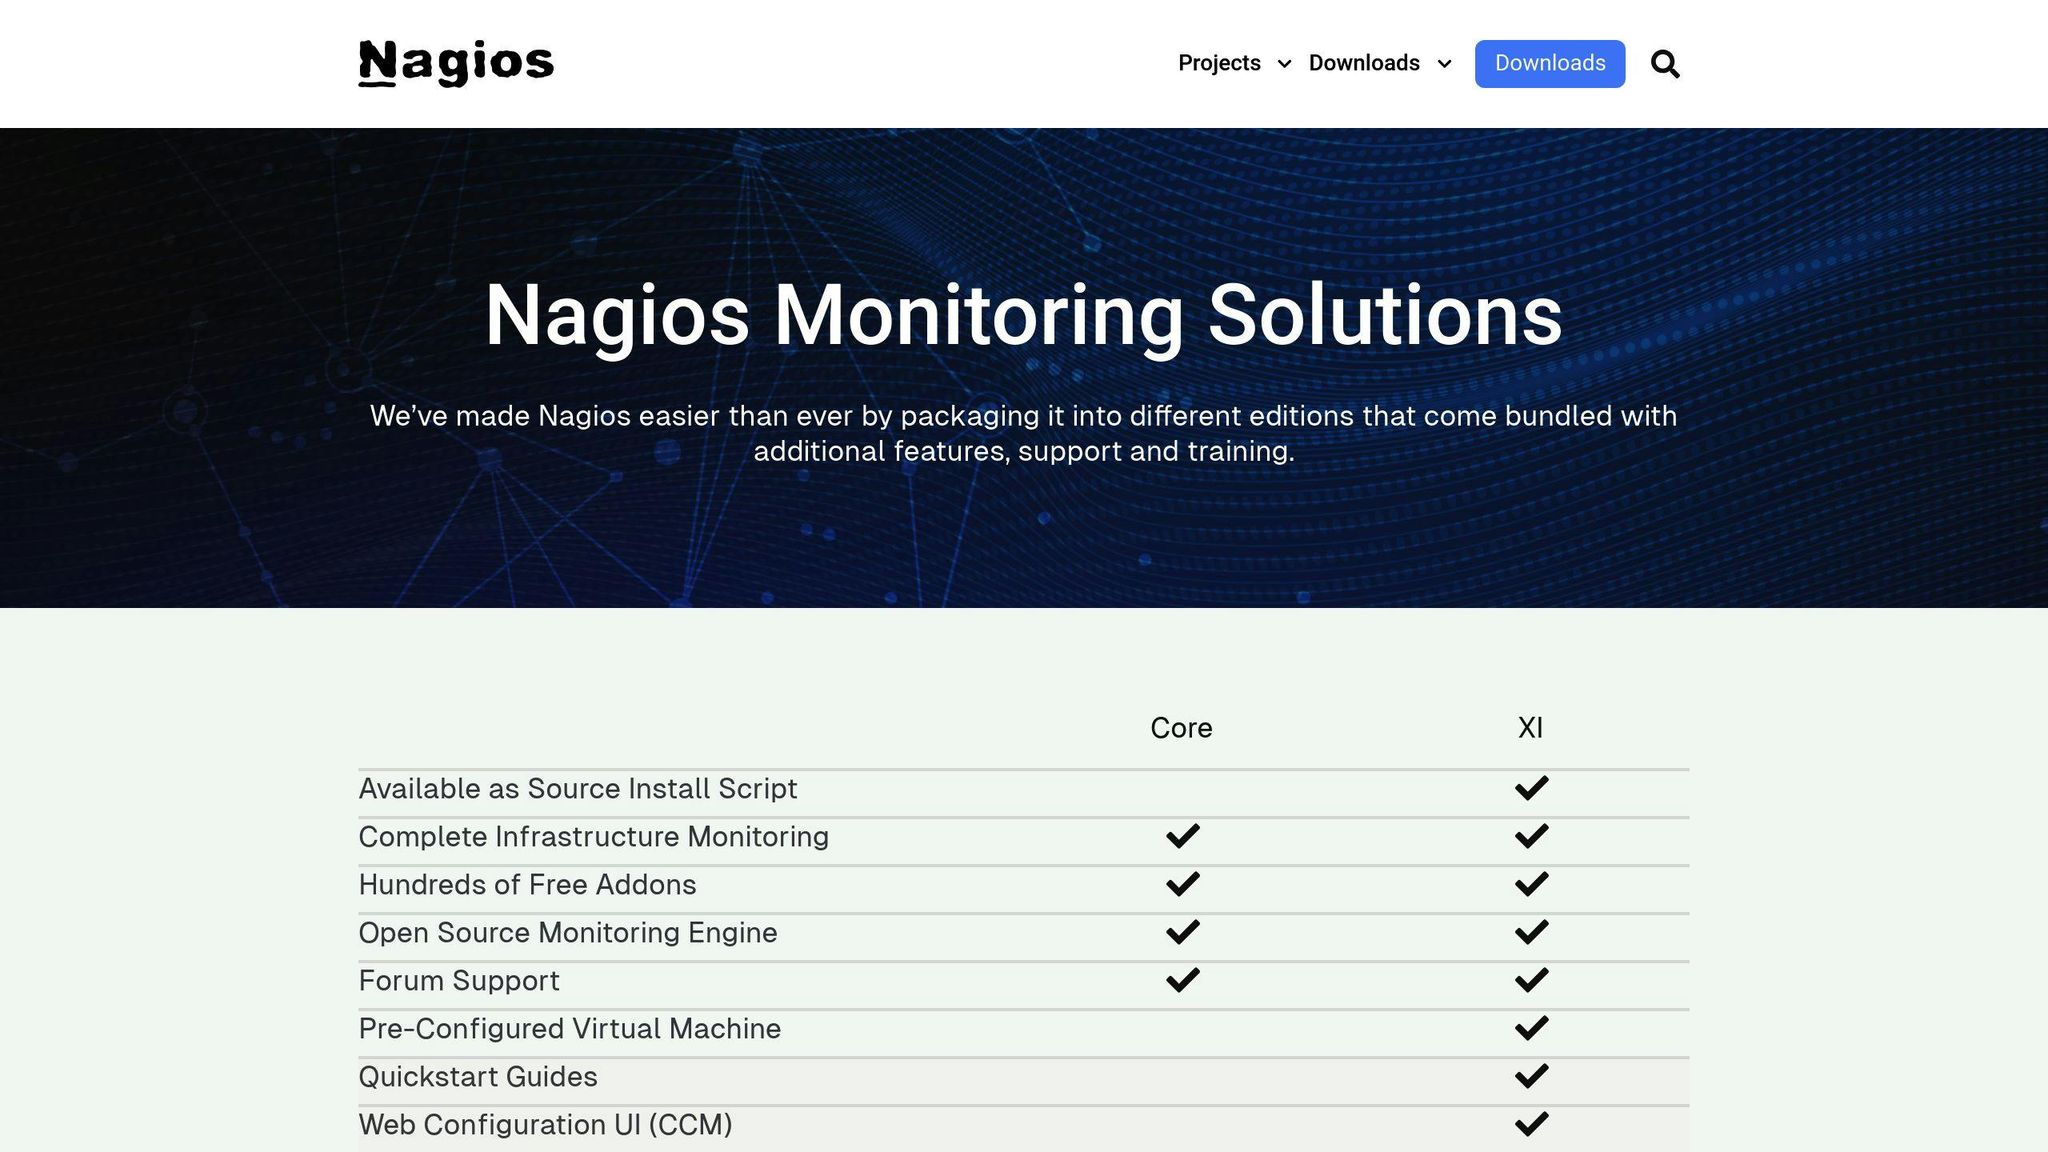
Nagios Core keeps things simple but effective:
| Component | Function | Best For |
|---|---|---|
| Core System | Basic monitoring | Small-medium networks |
| Plugins | 5000+ add-ons | Specific tasks |
| Config Tools | NConf, Centreon | Quick setup |
| Graphing | PNP4Nagios | Track performance |
Prometheus and Alertmanager
Prometheus stands out with these features:
| Capability | Implementation | Output |
|---|---|---|
| Time Series DB | Pulls metrics | Data history |
| Query Language | PromQL | Custom reports |
| Alert Rules | YAML files | Notifications |
| Service Discovery | Finds targets | Dynamic setups |
OpenNMS
OpenNMS brings enterprise-grade monitoring:
| Module | Purpose | Scale |
|---|---|---|
| Meridian | Long-term support | Big networks |
| Horizon | Community version | Test environments |
| Flow Analysis | NetFlow handling | Traffic tracking |
| Topology | Network mapping | System views |
Here's what makes each tool special:
- Zabbix: Works great with both old and new systems
- Nagios Core: Perfect for basic monitoring
- Prometheus: Built for containers and microservices
- OpenNMS: Handles big, complex networks
Pick your tool based on these factors:
| Tool | Network Size | Learning Curve | Update Frequency |
|---|---|---|---|
| Zabbix | Medium-Large | Medium | Quarterly |
| Nagios Core | Small-Medium | High | Monthly |
| Prometheus | Any | Medium | Bi-weekly |
| OpenNMS | Large | High | Monthly |
Optimizing Network Monitoring on Linux
Here's what you need to know about network monitoring on Linux systems - from tool selection to setup.
Top Network Monitoring Tools for Linux
Linux comes packed with monitoring tools. Here are the ones that get the job done:
| Tool | Linux Integration | Performance Impact | Memory Usage |
|---|---|---|---|
| Nagios Core | Native support | 2-5% CPU | 256MB - 1GB |
| Zabbix | Built for Linux | 5-10% CPU | 1GB - 4GB |
| Icinga 2 | Native support | 3-7% CPU | 512MB - 2GB |
| Cacti | Full compatibility | 1-3% CPU | 256MB - 1GB |
Built-in Linux Network Tools
Linux comes with powerful networking tools right out of the box:
| Tool | Command | What It Does |
|---|---|---|
| netstat | netstat -tulpn |
Shows open ports |
| tcpdump | tcpdump -i any |
Captures network traffic |
| iptables | iptables -L |
Displays firewall rules |
| ss | ss -s |
Shows network connections |
Cacti + RRDTool: Your Network Data Visualized
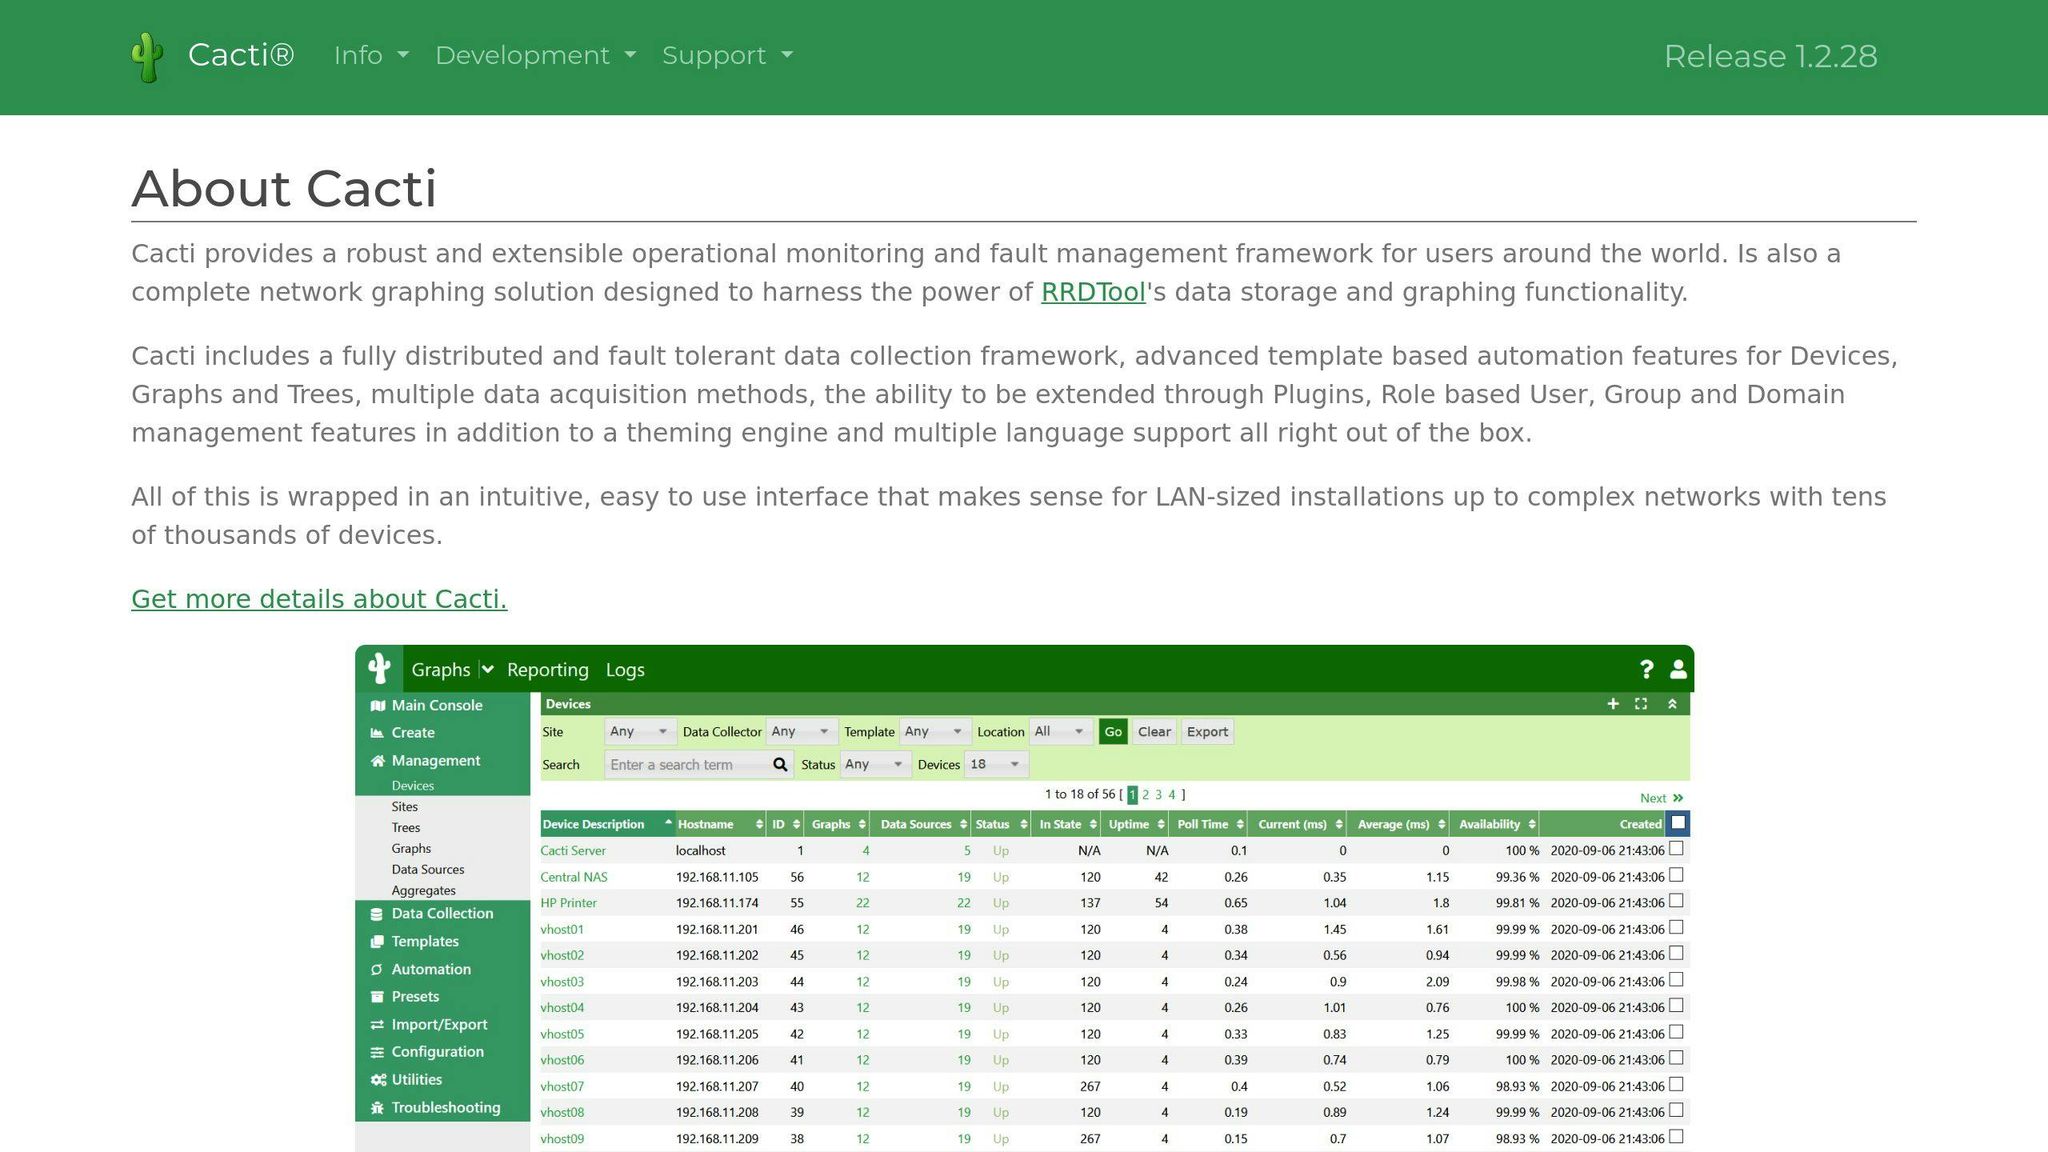
Here's what Cacti tracks by default:
| What It Tracks | How Often | Storage Needed |
|---|---|---|
| Network Traffic | 5 minutes | 100MB/month |
| CPU Load | 1 minute | 50MB/month |
| Memory Usage | 5 minutes | 75MB/month |
| Disk I/O | 1 minute | 80MB/month |
Icinga 2: Next-Level Network Monitoring
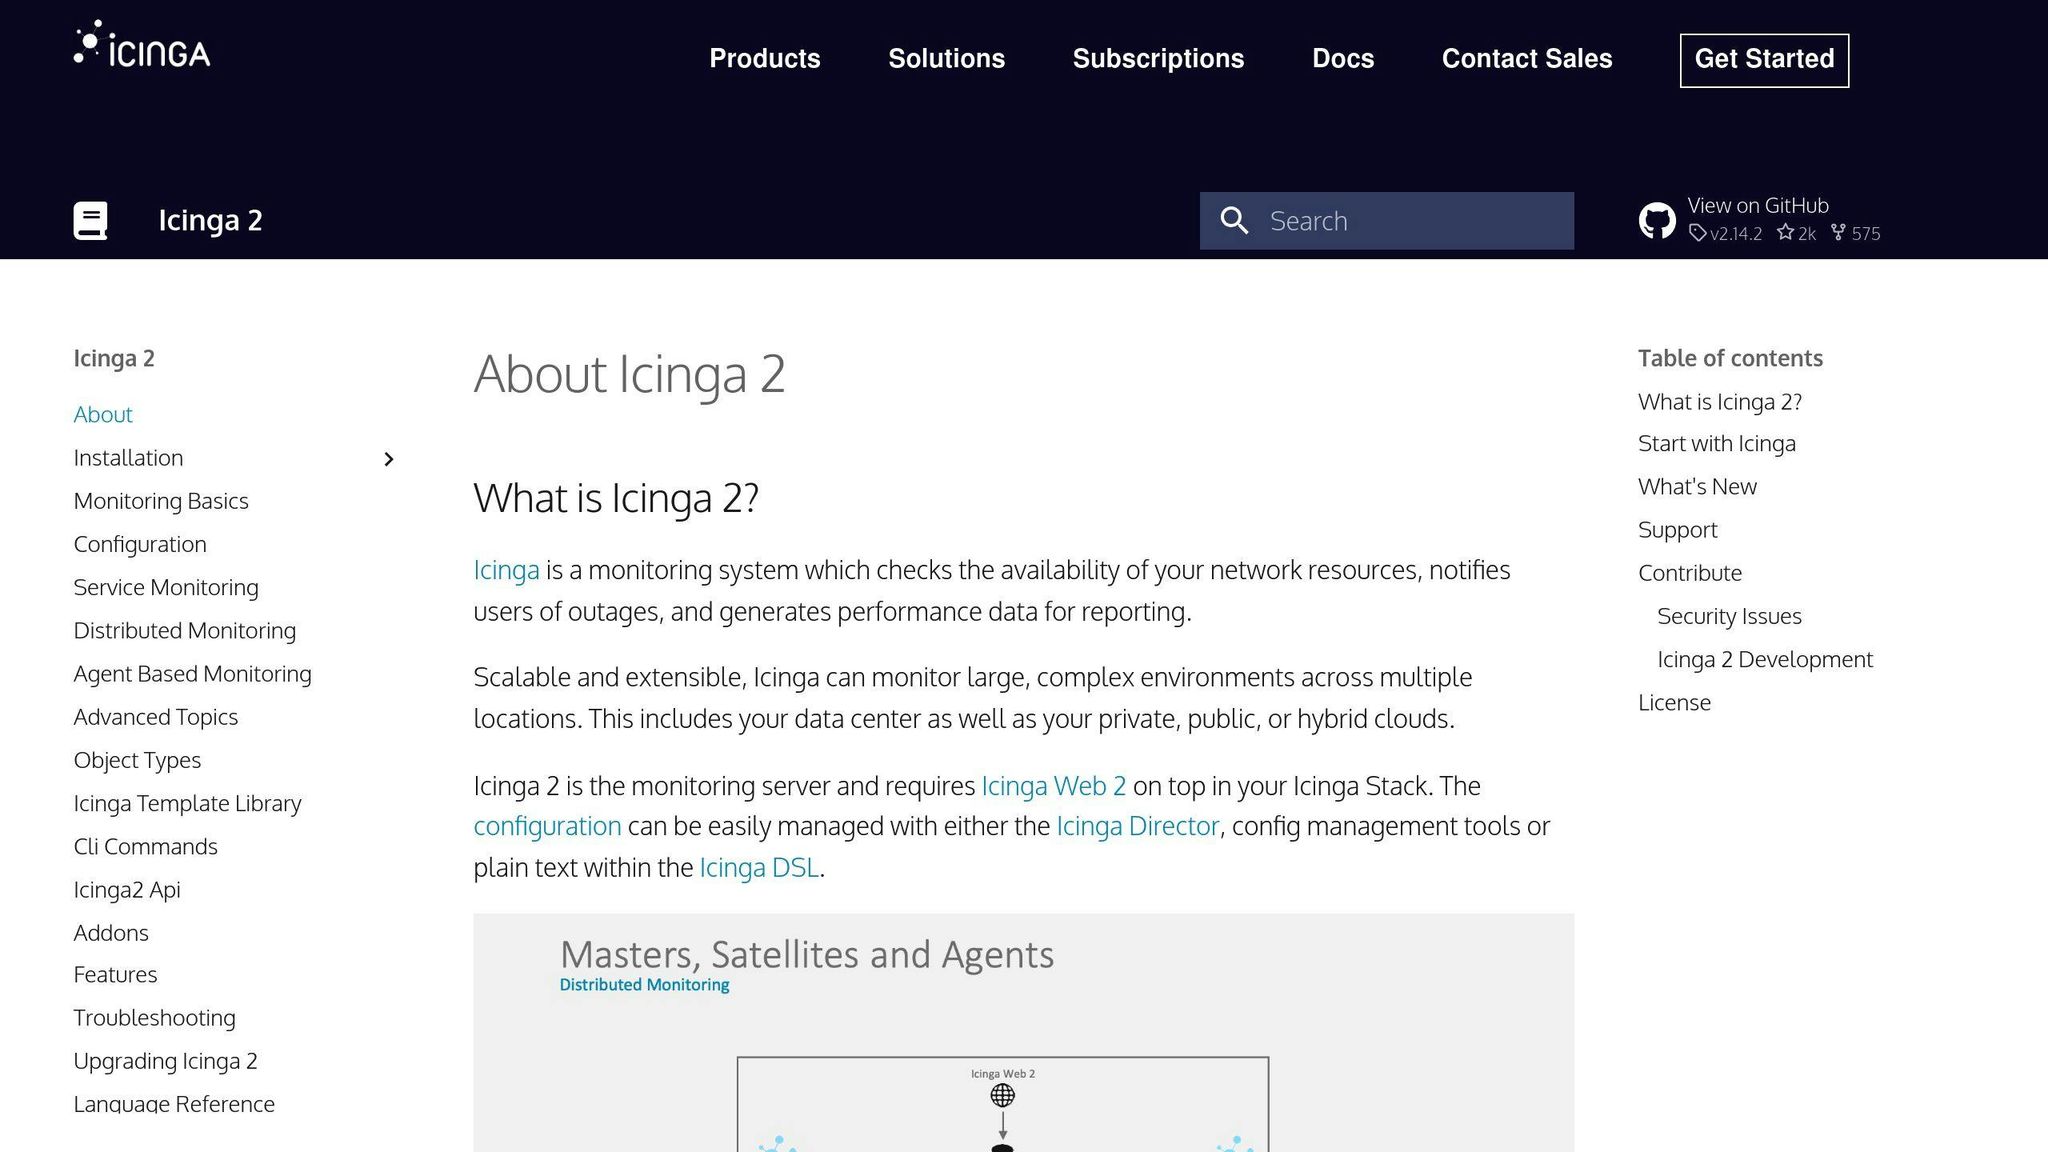
Want to set up Icinga 2? Here's what you'll work with:
| Part | What It Does | Setup Time |
|---|---|---|
| Check Commands | Monitors system health | 10-15 minutes |
| Notifications | Sends alerts | 5-10 minutes |
| DB Backend | Stores your data | 20-30 minutes |
| Web Interface | Shows system status | 15-20 minutes |
Quick setup tips:
- Use systemd to manage services
- Set up log rotation (your disk will thank you)
- Turn on SNMP for device monitoring
- Use SSH keys instead of passwords
Implementing Open Source Network Monitoring
Here's how to set up and run network monitoring that works:
Initial Setup and Configuration
Your monitoring system needs the right foundation to work well:
| Step | Action | Time Required |
|---|---|---|
| Server Setup | Linux server: 4+ CPU cores, 8GB+ RAM | 30-45 minutes |
| Database Config | PostgreSQL/MySQL with indexes | 20-30 minutes |
| Network Access | SNMP v3 + SSH keys | 15-20 minutes |
| Monitoring Agent | Auto-deploy to target systems | 10-15 minutes per 100 hosts |
Device Discovery Setup
Your system needs to find and track devices automatically:
| Discovery Method | What It Checks | How Often |
|---|---|---|
| Network Scan | IPv4/IPv6 subnets | Every 6 hours |
| Service Detection | TCP/UDP ports | Every 12 hours |
| SNMP Walk | Device inventory | Every 24 hours |
| API Integration | Cloud resources | Every 15 minutes |
Setting Up Smart Alerts
Here's when your system should notify you:
| What to Watch | Warning at | Critical at | How You'll Know |
|---|---|---|---|
| CPU Usage | >80% for 5 min | >90% for 2 min | Email + SMS |
| Memory | >85% used | >95% used | Slack + Email |
| Disk Space | >85% full | >95% full | Email + Phone |
| Network Load | >70% capacity | >90% capacity | All channels |
Keep Your System Running
Do these tasks to keep everything working:
| Task | When | Why It Matters |
|---|---|---|
| Clean Database | Weekly | Keeps system fast |
| Update Security | Monthly | Stops attacks |
| Backup Config | Daily | Saves your setup |
| Upgrade Version | Every 3 months | Gets new features |
Quick Tips:
- Update when traffic is low
- Test updates on a test system
- Save configs in git
- Backup before big changes
Conclusion: Maximizing the Impact of Open Source Network Monitoring
Let's break down what makes open source monitoring tools work for your network.
Here's what you get with open source tools:
| Benefit | Impact | Cost Savings |
|---|---|---|
| Code Access | Fix bugs and customize directly | $0 licensing fees |
| Community Support | Get help anytime, anywhere | No support contracts |
| Security Updates | Deploy patches fast | No maintenance fees |
| Integration Options | Works with everything | No API costs |
Want to pick the right tool? Here's what works best for different network sizes:
| Network Size | Best Tool | What You Get |
|---|---|---|
| Small (<100 devices) | Nagios Core | Basic monitoring + email alerts |
| Medium (100-1000) | Zabbix | Finds devices automatically + custom views |
| Large (1000+) | OpenNMS | Handles big networks + split monitoring |
| Cloud-Native | Prometheus | Watches containers + tracks changes |
What's next for network monitoring? Here's what's coming:
| What's New | When | Why It Matters |
|---|---|---|
| AI Finds Problems | 2024-2025 | Spots issues 60% faster |
| Built for Containers | 2024 | Setup in 80% less time |
| Edge Computing | 2025 | Uses 40% less bandwidth |
| Zero-Trust Security | 2024 | Covers 90% more security gaps |
Want to get the most from your monitoring? Do these 4 things:
- Try updates in test mode first
- Get involved on GitHub
- Back up everything
- Write down your changes
That's it. Simple, effective network monitoring without the fancy price tag.


